News
2015's best perceived QSR rankings released
Consumer perception research firm YouGov BrandIndex released its annual rankings for the best perceived QSR dining chains in the country.
January 14, 2016
 ChatGPT
 Grok
Grok Perplexity
 Claude
Consumer perception research firm YouGov BrandIndex released its annual rankings for the best perceived QSR dining chains in the country (top five in each category).
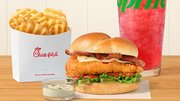
Although Subway dropped out of the U.S. Top 10 Buzz Rankings list, the brand has maintained its lead of the QSR sector, according to the YouGov BrandIndex website. The strongest gainer for the year, Chick-fil-A, entered the QSR leaderboard at No. 3.
In 2015, Chick-fil-A opened 88 new restaurants, including their first Manhattan space. Chick-Fil-A started rolling out table service, revamped its coffee and introduced a healthy kale and broccolini salad in place of their coleslaw.
QSR Top Buzz Ranking
| Rank | Brand | 2015 Score |
| 1 | Subway | 17.2 |
| 2 | Wendy's | 14.3 |
| 3 | Chick-fil-A | 14.0 |
| 4 | Pizza Hut | 12.9 |
| 5 | Sonic | 11.4 |
QSR: Top Buzz Improvers
| Rank | Brand | 2015 | 2014 | Change in Score |
| 1 | Chick-fil-A | 14.0 | 11.7 | 2.3 |
| 2 | Domino's | 9.9 | 9.0 | 0.9 |
| 3 | McDonald's | 4.6 | 4.0 | 0.6 |
| 4 | White Castle | 2.0 | 1.7 | 0.3 |
| 5 | Qdoba | 1.5 | 1.2 | 0.3 |
Methodology:
These brands were rated using YouGov BrandIndex's Buzz score, which asks respondents, "If you've heard anything about the brand in the last two weeks, through advertising, news or word of mouth, was it positive or negative?"
Buzz scores can range from 100 to -100 and are compiled by subtracting negative feedback from positive. A zero score means equal positive and negative feedback. Example: A score of 35 means that 35 percent more people said they were positive than negative about the brand.
Approximately 30,000 adults 18 and over were interviewed with a margin of error of +/- 2 percent.
The Buzz Rankings chart shows the brands with the highest average Buzz scores between January and December 2015. The Buzz Improvers chart ranks the brands with the highest increase in Buzz comparing years 2014 and 2015. Both scores are representative of the general population.
Related Media
Subscribe
Get the latest news and resources from QSR Web.
Recent Posts